
Accessible Images
Images are an important way to communicate. Photographs, diagrams, maps, charts, visualizations, sketches, icons, and more: all of these convey information to their viewers. We use images in courses to add visual appeal, to convey information concisely, to demonstrate a process.
However, images rely on vision. If someone has limited or no vision, or other visual disabilities like colorblindness, they may not be able to fully engage with the image. The communication fails.
In order to make images accessible to everyone, we use alternative text, more commonly referred to as alt text or image descriptions. The simplest definition is that alt text is a text description of an image, which sounds simple enough. But actually writing alt text can prove quite challenging! It’s more of an art than a science: there’s no secret formula or setting that will make every image accessible to everyone, every time. Instead, you have to consider the content of the image, the context in which it’s placed, and what information it needs to convey.
Who Needs Alt Text?
Alt text is a critical accessibility support for anyone using a screen reader. Screen readers are software tools that read the content of a computer screen aloud, including context about navigation, layout, menus, and more. Screen readers can’t actually see images, though, and rely on alt text to tell the user what the image is.
Alt text benefits other users as well. People in areas with limited internet connections may not be able to load large images, or sometimes any images at all. But text is far less taxing to download, and so even if a user can’t see an image, they can still read the description and understand what information is being conveyed.
How to Add Alt Text
Instructure has a guide on how to embed images in Canvas, including how to add alt text and how to mark an image as decorative. Canvas requires that an image either has alt text or is marked as decorative; you will not be able to save the image otherwise.
Microsoft Office 365 supports alt text in all of its programs, and alt text can be added in many older versions of the Microsoft suite as well. The Google Apps suite also supports adding alt text to documents and presentations.
Alt Text Key Concepts
Never leave the file name as the alt text on an image.
By default, Canvas fills in the file name as the alt text when uploading an image. Under no circumstances is the file name acceptable alt text. Delete the file name and either enter the correct alt text or mark the image as decorative.
Context is key.
The alt text that an image needs depends not only on what the image is, but on the information surrounding the image. What information is on the page that relates to the image? What information do students get from viewing the image? What information does the image itself communicate?
Decorative images don’t need alt text.
After considering the context and what information it conveys, you may reach the conclusion that it doesn’t convey any information. It’s an icon included to help students quickly identify different elements of a module overview page, or it’s a stock photo used to break up a wall of text. But it doesn’t actually have any academic purpose. In that case, it is decorative and does not need alt text. The alt text field should be left blank and the image marked as decorative.
Describe the information, not the image.
This can be a tricky concept! Images are a way of conveying information, just like text or speech. For simple images, like this photo of a kitten on a couch, the information conveyed is pretty straightforward.

The alt text for this could be “a sleepy orange kitten on a couch.” If you wanted to get really detailed--and if it was relevant for the user to know--you could describe the fact that it is a close-up shot, or the placement of the kitten’s paws.
Unfortunately, there aren’t many opportunities to include pictures of kittens in our course sites. More often, faculty will ask students to look at complex charts, graphs, diagrams, or maps.
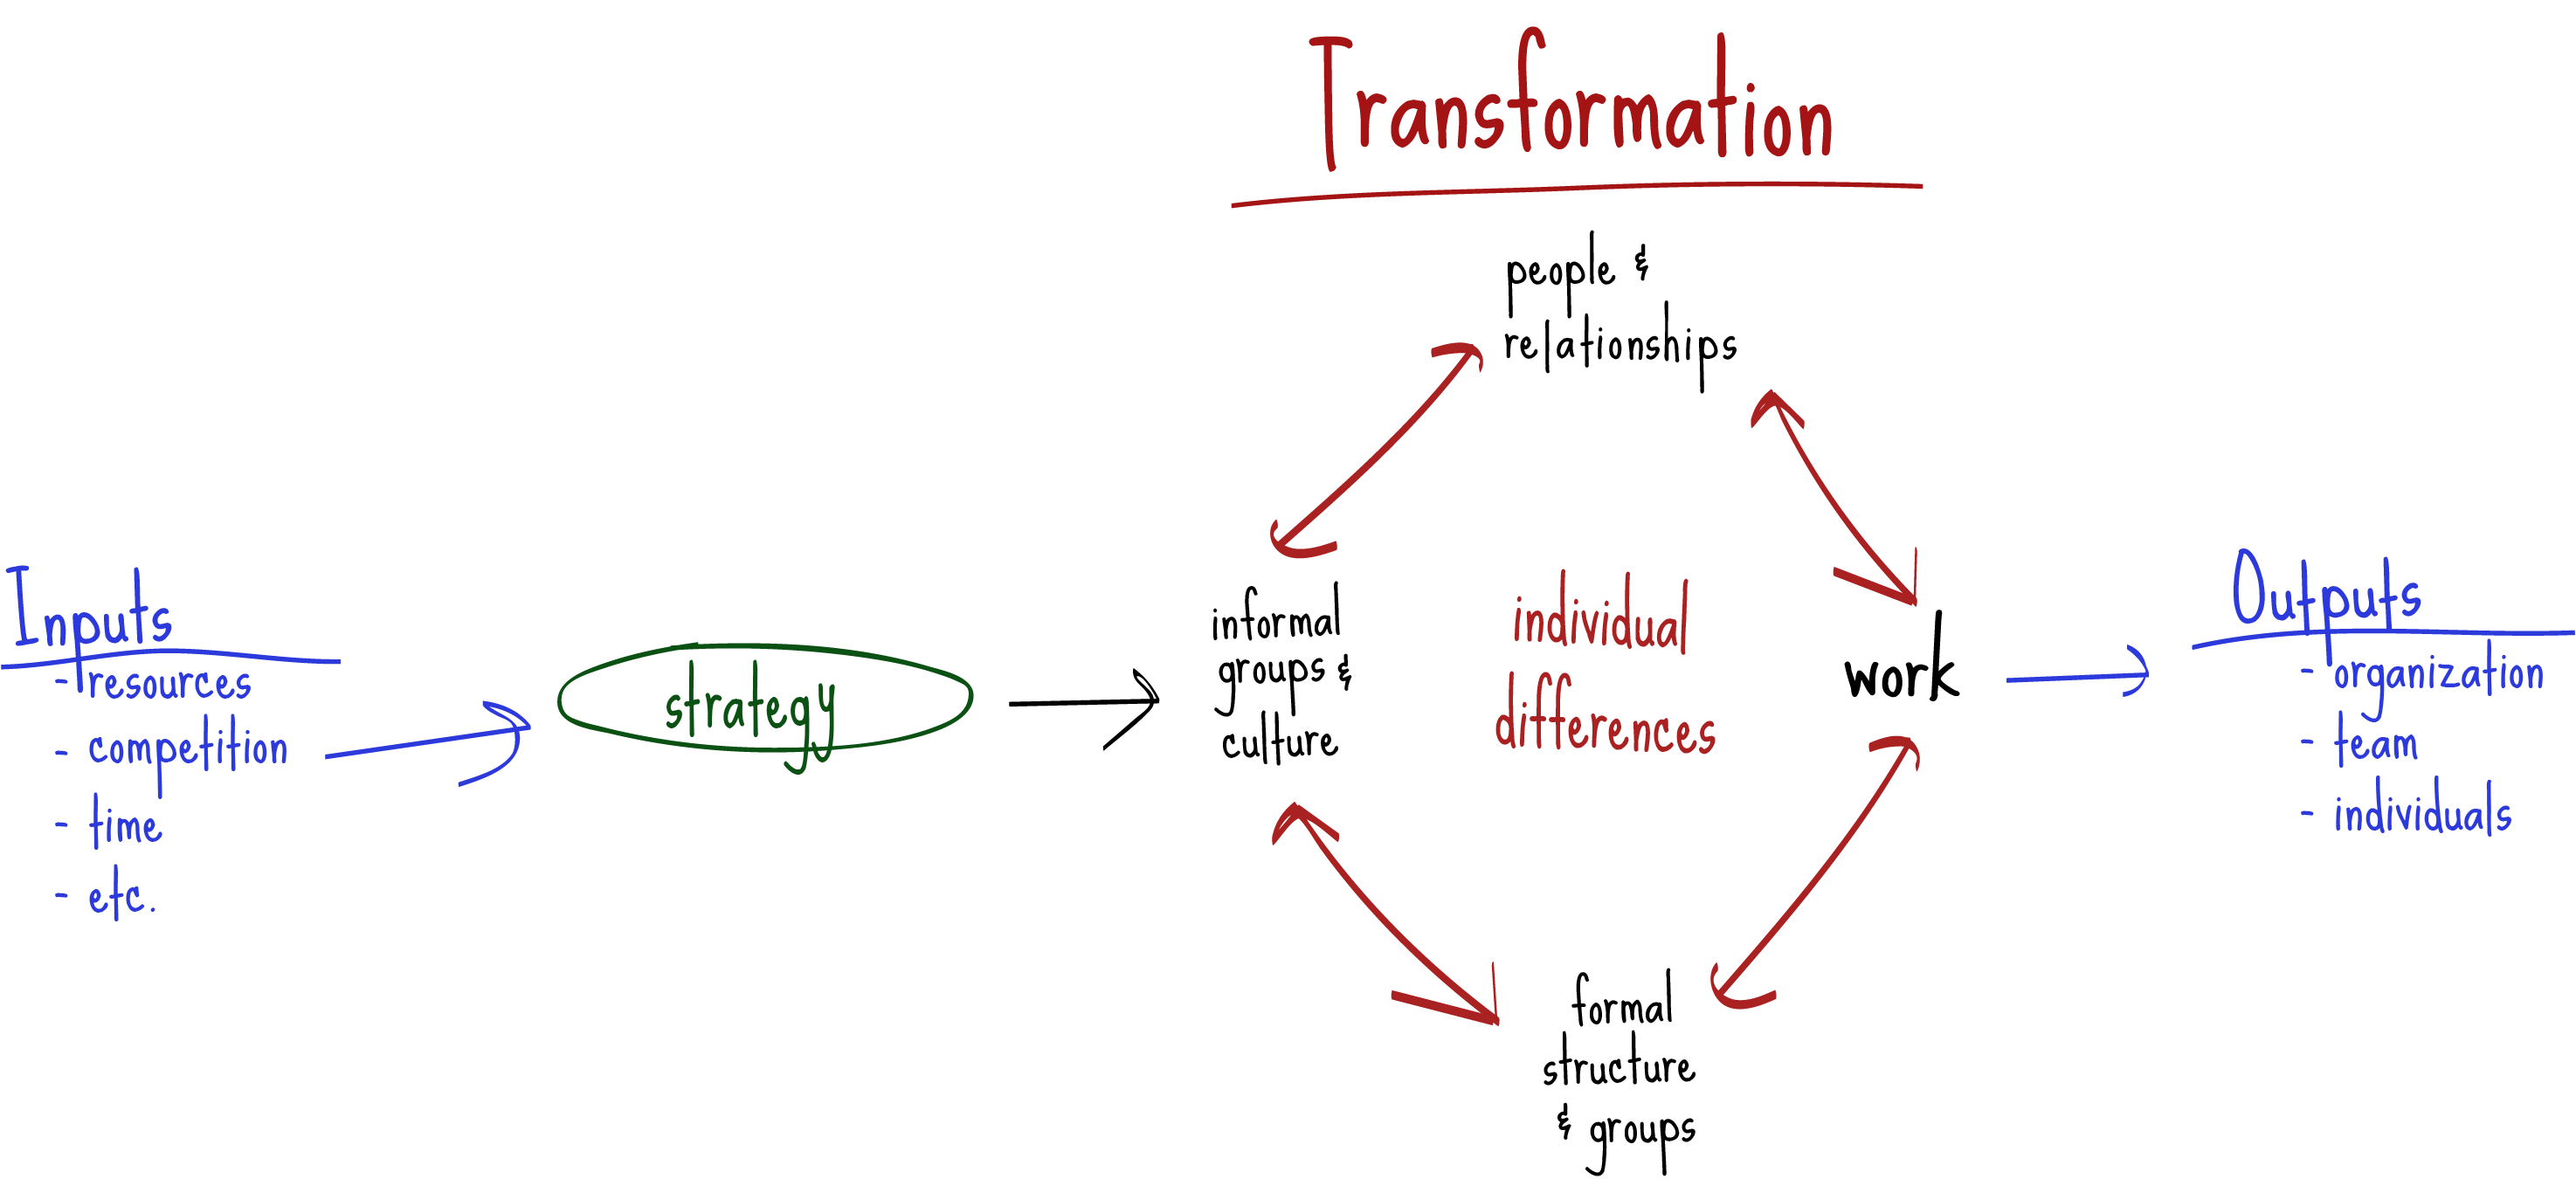 Organizational Transformation image taken from ORG BEH 301. Do not distribute.
When writing alt text for this image, it’s important to focus on the information, not what the image looks like. Talking about the color of the lines or their position relative to each other isn’t helpful to a student who can’t see the graphic in the first place. Students need to understand the connections between each element in the diagram, what parts lead into each other, and so on.
For example, the alt text on this image might begin: “The process of transformation includes many steps. It begins with inputs like resources, competition, and time, which then lead into the strategy. The strategy leads into individual differences…”
Write out the text on the image.
Related to the above, if your image contains text, that text should be included in the alt text… as long as it isn’t redundant with other text on the page. So if you include a screenshot of a page from a book, the alt text would need to transcribe the text on the page, which rather defeats the purpose of taking a screenshot. In general, if there’s a lengthy section of text that’s going to be included, type it out or copy/paste it and add it (with appropriate citations!) as a quote, rather than an image.
However, things like header banners will have a brief amount of text, and that text can be repeated as the alt text. But again, consider the context. If the text on the banner is the same as the page title, it probably doesn’t need alt text.
Don’t start alt text by saying that it’s an image.
Thanks to the HTML code of the course site, a screen reader will be able to identify that an item is an image and will communicate that to a user before reaching your alt text description. So it is unnecessary, in most cases, to start your description by saying “an image of” or “a graphic depicting.” Just launch right into the description. The one exception to this rule is if the nature of the image is relevant information for students to have. For example, if it’s important to know that “green, rolling hills stretching to the horizon under a bright blue sky” is a painting and not a photo, then you can begin the description by saying “a painting of…”. But that is a rare exception and in general, specifying the type of image is not necessary.
Alt Text for STEM Images
Higher education often utilizes images that convey a dense amount of information. Maps, diagrams, flowcharts, graphs, and more--these are visualizations that allow sighted readers to take in a high amount of data or information very quickly. But blind and low-vision users may not be able to see these visual representations. Figuring out how to convey the information contained in complex images in text form can be tricky!
This guide, based on a presentation given by Dr. Valerie Morrison (Georgia Tech) for AHEAD in February 2021, breaks down specific considerations when writing alt text for complex images. The context of an image is critical to writing a good description.
Cognitive Load
A key concept to keep in mind when writing alt text for complex images is cognitive load. This refers to a person’s mental resources, especially working memory, when engaging with information. This is especially important when thinking about screen reader users and how they interact with alt text. Someone viewing a graph can glance around the image as much as they need to in order to refresh themselves on different data points.
But a screen reader user is listening to an audio version of that information--and depending on the screen reader, the user may not be able to rewind or replay the alt text with ease. This means that screen reader users may have to hold a lot of information in their working memory in order to understand the data. Most people can only hold about seven items in their working memory at once; more than that, and information is lost. (For individuals with cognitive disabilities, the amount might be considerably less.) Learning is improved when the number of items that have to be stored in working memory are reduced.
Writing Alt Text with Cognitive Load in Mind
Here are some general tips for writing alt text in a way that will reduce cognitive load.
- Simplify word choice and edit for clarity.
- Avoid redundancies with surrounding text, or write brief alt text directing users to information in a table or attached content page.
- Use parallel structure and clear, concise word choice.
- Spell out acronyms or abbreviations and explain what symbols stand for.
- Work from general to specific.
- Group similar items and describe relationships, and describe similarities first, then differences.
- Organize information in predictable, consistent ways.
- Focus on meaning rather than appearance.
- Take the time to edit the alt text after you’ve written it. Return to it after a day and read through it to ensure that it is clear, precise, and easy to understand.
STEM Content
There are numerous types of complex images that often appear in STEM (science, technology, engineering, and mathematics) courses. The following tips explain how to write good alt text for many of these types of images. It’s important to note that, in many cases, the alt text won’t be placed in the alt text field of the image; instead, it may be a table underneath the image or a linked content page with paragraphs of description.
Bar Graph
Work from general to specific. Begin with the type of graph and the name of the graph, then give the names of the horizontal and vertical axes. Then describe the data in as much detail as the course requires, which could be overall trends or specific numbers. The data could also be conveyed in a properly formatted, accessible table below the image for improved accessibility.
Line Graph
Include the title of the graph, the X and Y axes and ranges. Summarize line trends (car purchases have increased steadily, home purchases have declined, rentals have increased with a sharp dip between January and April). If specific data points are needed, convert the information into a table.
Flowcharts
Reproduce the information on a separate content page in a numbered list or in paragraphs with clearly labeled headings. In both cases, information on how to proceed should be clearly stated (if Yes, proceed to Step 3. If No, proceed to Step 4).
Complex Infographic or Diagram
Begin with a general overview, such as the title or a high-level description of the information. Comprehensive information, such as a detailed walkthrough of the image, can be provided on a separate content page if needed for the course. Depending on the complexity of the image, one or more tables can be used to organize the data as well.
Maps
Describe the areas, regions, and relevant details on the map. You do not have to include every country or state mentioned, for example--only the ones relevant to the information students need to get from the map. In addition, be sure to describe any insets or zoomed-in areas of focus. Colors, shapes, and arrows can be left out of descriptions.
Timelines
Begin by describing the range of the timeline and the type of events listed. For example, “Rulers of Renaissance Europe, 1400-1600.” Then list events by date. If the timeline is fairly short (fewer than five items), this can be in the alt text field. Otherwise, consider a numbered list broken up by era (or whatever time frame makes the most sense). Any additional text information should be included as well.
Math and Chemistry Equations
It is important to write alt text for all equations, even those rendered in Canvas with LaTeX. LaTeX’s version of alt text is very specific to that program, and majority of students will not be familiar with it. Instead, the alt text needs to be written in plain English. This guide from Penn State includes some guidance on how to do this, and there are some examples on the Accessible Writing and Math page. (Unfortunately, because we do not have MathML or MathJax enabled in Canvas, our options for for writing alt text for math are very limited.) This applies to chemical equations as well.
Implied Visual Information
Creators may sometimes arrange or present the data to make a point visually. For example, in a graph showing military spending by country, structuring the graph so that the United States is at the top with a much larger bar than any other country is making a statement about the budget priorities of the United States. This implicit communication of information needs to be considered and conveyed in the alt text as well, but it’s important to still remain objective. Explain what the graphic is communicating and how, but don’t inject your own opinions or your assumptions about the creator’s opinions into the alt text.
Resources
Questions for Alt Text Authors
It can be hard to get into the right frame of mind to write alt text, especially for complex images. Here are some prompts and questions to ask yourself (or the person who is writing the alt text) to start thinking about it.
- Imagine you can’t use an image to communicate the information to the students. What would you need to write so that they learned the same thing?
- What are the key things (top three, top five) that students need to understand by looking at this image?
- How is the knowledge gained from this image going to be assessed? What will students be asked about that relates to this image?
- If you took this image out of the page and replaced it with the alt text, would the page still make sense?
Further Resources
- WebAIM: Alt Text: WebAIM is an excellent resource for web accessibility, and much of the Key Content section is based on their guidance.
- National Center for Accessible Media: Guidelines for Describing STEM Images: Detailed information on how to write alt text for STEM images.
- Writing Alt Text for Museum Pieces: Blog post from the Block Museum on the experience of writing alt text description for fine art.